

MAKE SMARTER
DECISIONS IN JAPAN
WITH REAL DATA
Using advanced analytics and trusted datasets, TopTen reveals the trends, rankings, and insights across Japan's property market.

See Japan’s property trends through 380,000+ real data points
Top Ten Feature Story
2026 Oct #01
Fukuoka on the Rise
Fukuoka ranks second in mansion returns as of May 2026, behind Tokyo and ahead of Osaka.
1,612,392
Population
4.8%
Population Growth
91%
Housing Occupied Rate
40,424
Exiting Mansions Price/Sqft (Yen)
96,648
New Mansion Price/Sqft (Yen)


78,937
Jan 2026
New Mansion Median Price/Sqft (JPY)
40,146
Jan 2026
New House Median Price/Sqft (JPY)
36,056
Jan 2026
Used Mansion Median Price/Sqft (JPY)
32,079
Jan 2026
Used House Median Price/Sqft (JPY)
-1.1
Jan 2021
Rental Index (%)
119.6
Jan 2026
Existing Mansions Price Return (Index Cal. in JPY)
Fukuoka by the Numbers
01
TOKYO 23 WARDS
45.3 m²
Estimated buying power
¥2.21M/m²
BENCHMARK
02
Yokhama
45.3 m²
Estimated buying power
¥2.21M/m²
+102% vs Tokyo
03
Fukuoka
45.3 m²
Estimated buying power
¥2.21M/m²
+102% vs Tokyo
04
Osaka
45.3 m²
Estimated buying power
¥2.21M/m²
+102% vs Tokyo
05
Kyoto
45.3 m²
Estimated buying power
¥2.21M/m²
+102% vs Tokyo
06
Nagoya
45.3 m²
Estimated buying power
¥2.21M/m²
+102% vs Tokyo
07
Chiba
45.3 m²
Estimated buying power
¥2.21M/m²
+102% vs Tokyo
08
Saitama
45.3 m²
Estimated buying power
¥2.21M/m²
+102% vs Tokyo

We specialize in data generation, precise analysis, accurate calculations, and advanced filtering to deliver reliable, actionable insights.
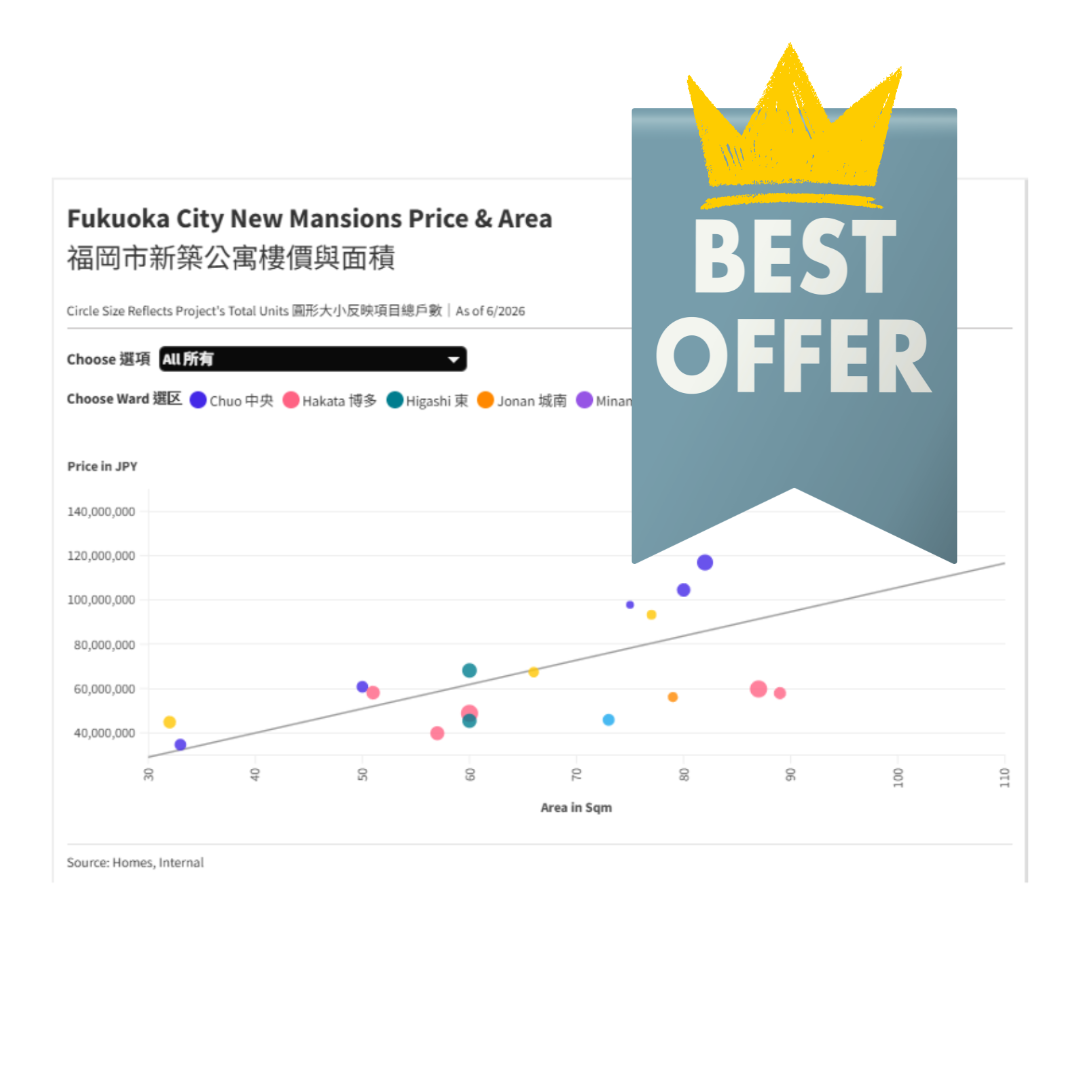
Featured New Mansions in Fukuoka


.png)


Behind Our Calculations:
Key Elements Shaping the Data
[1]
Median Price
The median price shows the middle point of all property prices. It helps you understand what a typical property costs, without being affected by unusually expensive or cheap listings.
[2]
Property Price Index
The index shows how property prices move over time. With a base level of 100, values above 100 indicate price growth, while values below 100 indicate a decline—helping you quickly understand market trends at a glance.
[3]
Data Filtering Technology
Our proprietary filtering technology removes duplicate, incomplete, and abnormal records, allowing us to present cleaner, more reliable data. This ensures users gain meaningful insights based on high-quality information rather than raw data alone.
[4]
Data Analysis Team
Our dedicated data analysis team collects, verifies, and organizes information from trusted sources to ensure every chart and ranking is accurate, consistent, and up to date. Each dataset undergoes careful review before publication.


.png)
.png)
Japan’s Smartest
Value Picks
With around 467 new mansions currently on the Japanese market, finding the right opportunity takes more than simply browsing listings. We use real data to uncover where quality meets value.


Japan Property
Price Index (Base 100)
135.5
New Mansion
113.6
New House
103.7
Used Mansion
98.2
Used House
New Mansion Price
Index (Base 100)
Top 4 Refencing Cities as of Aug 2026
191
Tokyo
154
Chiba
152
Fukuoka
135
Sapporo
Existing Mansion Price Index
Japan: 104. Which cities rank above the rest?
134
Fukuoka
170
Tokyo
132
Osaka
Why Japan?
Because Quality Has A Name


